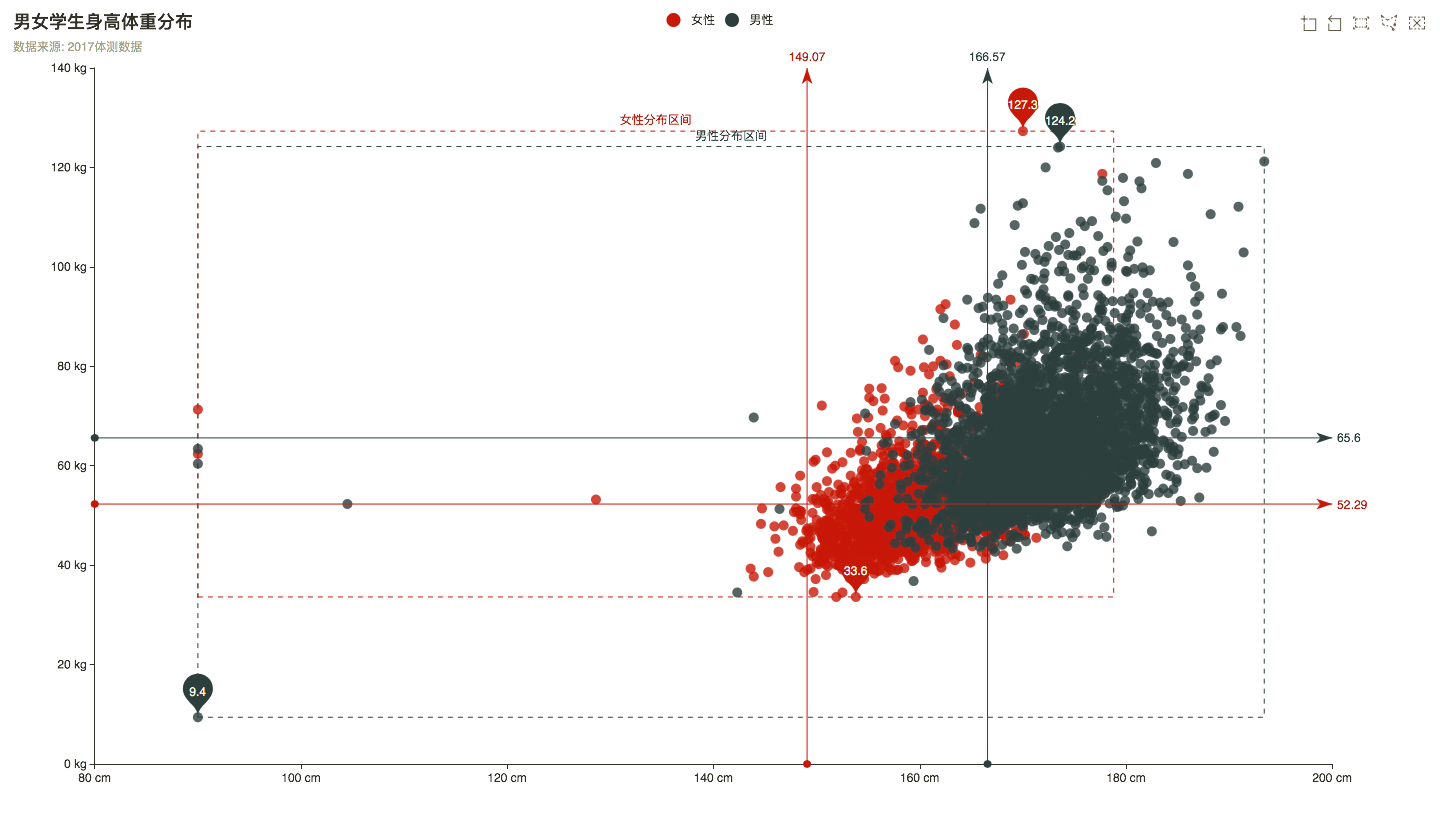
echarts+ajax+java制作图表
整理了下学校男女身高体重数据,顺便当复习java了
charts在绘图前我们需要为其准备一个具备高宽的 DOM 容器。
<body>
    <!-- 为 ECharts 准备一个具备大小(宽高)的 DOM -->
    <div id="main" style="width: 600px;height:400px;"></div>
</body>
然后就可以通过 echarts.init 方法初始化一个 echarts 实例并通过 setOption 方法生成分析图
图表样式就不细说了,这里就是借鉴了echarts官网的一个demo 然后加了个ajax
<!DOCTYPE html>
<head>
    <meta charset="utf-8">
    <title>hziee男女学生身高体重分布</title>
    <script src="js/echarts.js"></script>
    <script src="js/jquery-3.2.1.min.js"></script>
</head>
<body>
<div id="main" style="height:800px"></div>
<script type="text/javascript">
    var myChart = echarts.init(document.getElementById('main'));
    option = {
        title: {
            text: '男女学生身高体重分布',
            subtext: '数据来源: 2017体测数据'
        },
        grid: {
            left: '3%',
            right: '7%',
            bottom: '3%',
            containLabel: true
        },
        tooltip: {
//             trigger: 'axis',
            showDelay: 0,
            formatter: function (params) {
                if (params.value.length > 1) {
                    return params.seriesName + ' :<br/>'
                        + params.value[0] + 'cm '
                        + params.value[1] + 'kg ';
                }
                else {
                    return params.seriesName + ' :<br/>'
                        + params.name + ' : '
                        + params.value + 'kg ';
                }
            },
            axisPointer: {
                show: true,
                type: 'cross',
                lineStyle: {
                    type: 'dashed',
                    width: 1
                }
            }
        },
        toolbox: {
            feature: {
                dataZoom: {},
                brush: {
                    type: ['rect', 'polygon', 'clear']
                }
            }
        },
        brush: {},
        legend: {
            data: ['女性', '男性'],
            left: 'center'
        },
        xAxis: [
            {
                type: 'value',
                scale: true,
                axisLabel: {
                    formatter: '{value} cm'
                },
                splitLine: {
                    show: false
                }
            }
        ],
        yAxis: [
            {
                type: 'value',
                scale: true,
                axisLabel: {
                    formatter: '{value} kg'
                },
                splitLine: {
                    show: false
                }
            }
        ],
        series: [
            {
                name: '女性',
                type: 'scatter',
                data: [],
                markArea: {
                    silent: true,
                    itemStyle: {
                        normal: {
                            color: 'transparent',
                            borderWidth: 1,
                            borderType: 'dashed'
                        }
                    },
                    data: [[{
                        name: '女性分布区间',
                        xAxis: 'min',
                        yAxis: 'min'
                    }, {
                        xAxis: 'max',
                        yAxis: 'max'
                    }]]
                },
                markPoint: {
                    data: [
                        {type: 'max', name: '最大值'},
                        {type: 'min', name: '最小值'}
                    ]
                },
                markLine: {
                    lineStyle: {
                        normal: {
                            type: 'solid'
                        }
                    },
                    data: [
                        {type: 'average', name: '平均值'},
                        {xAxis: 149.07}
                    ]
                }
            },
            {
                name: '男性',
                type: 'scatter',
                data: [],
                markArea: {
                    silent: true,
                    itemStyle: {
                        normal: {
                            color: 'transparent',
                            borderWidth: 1,
                            borderType: 'dashed'
                        }
                    },
                    data: [[{
                        name: '男性分布区间',
                        xAxis: 'min',
                        yAxis: 'min'
                    }, {
                        xAxis: 'max',
                        yAxis: 'max'
                    }]]
                },
                markPoint: {
                    data: [
                        {type: 'max', name: '最大值'},
                        {type: 'min', name: '最小值'}
                    ]
                },
                markLine: {
                    lineStyle: {
                        normal: {
                            type: 'solid'
                        }
                    },
                    data: [
                        {type: 'average', name: '平均值'},
                        {xAxis: 166.57}
                    ]
                }
            }
        ]
    };
    myChart.showLoading();
    loadDATA(option);
    // 为echarts对象加载数据


    function loadDATA(option) {
        var girl = [];
        var boy = [];

        $.ajax({
            type: "post",
            async: true, //异步请求(同步请求将会锁住浏览器,用户其他操作必须等待请求完成才可以执行)
            url: "servlet/ShowInfo",
            data: {},
            dataType: "json", //返回数据形式为json
            success: function (result) {
                if (result) {
                    for (var i = 0; i < result.length; i++) {
                        if (result[i].sex === "女") {
                            girl.push([result[i].height, result[i].bweight]);
                        } else {
                            boy.push([result[i].height, result[i].bweight]);
                        }
                    }
                    myChart.hideLoading();
                    myChart.setOption({        //载入数据
                        series: [    //填入系列(内容)数据
                            {
                                // 根据名字对应到相应的系列
                                name: '女性',
                                data: girl
                            },
                            {
                                name: '男性',
                                data: boy
                            }
                        ]
                    });
                }
            }
        });
        myChart.setOption(option);
    }
</script>
</body>
写完才发现有个平均值,懒得写后端了,直接在数据库里算了一下放上去了
SELECT AVG(CONVERT(`身高`,DECIMAL)) FROM fitness2017 WHERE `性别`='男'"
这里还是主要记录下其他的实现过程
function loadDATA(option) {
        var girl = [];
        var boy = [];

        $.ajax({
            type: "post",
            async: true, //异步请求(同步请求将会锁住浏览器,用户其他操作必须等待请求完成才可以执行)
            url: "servlet/ShowInfo",
            data: {},
            dataType: "json", //返回数据形式为json
            success: function (result) {
                if (result) {
                    for (var i = 0; i < result.length; i++) {
                        if (result[i].sex === "女") {
                            girl.push([result[i].height, result[i].bweight]);
                        } else {
                            boy.push([result[i].height, result[i].bweight]);
                        }
                    }
                    myChart.hideLoading();
                    myChart.setOption({        //载入数据
                        series: [    //填入系列(内容)数据
                            {
                                // 根据名字对应到相应的系列
                                name: '女性',
                                data: girl
                            },
                            {
                                name: '男性',
                                data: boy
                            }
                        ]
                    });
                }
            }
        });
        myChart.setOption(option);
    }
前端用ajax请求servlet获取后台数据库内容返回的json
记得配置好xml
servlet代码
import FitnessSystem.entity.Info;
import FitnessSystem.logic.Student;
import com.google.gson.*;

import java.io.IOException;

import java.sql.SQLException;
import java.util.ArrayList;

/**
 * Created by Ruilin on 2017/12/27.
 */
public class ShowInfo extends javax.servlet.http.HttpServlet {

    protected void doPost(javax.servlet.http.HttpServletRequest request, javax.servlet.http.HttpServletResponse response) throws javax.servlet.ServletException, IOException {
//        request.setCharacterEncoding("utf-8");
        Student stu = new Student();
        try {
            ArrayList<Info> stuArray = stu.getStudentList();
            Gson gson = new Gson();
            String json = gson.toJson(stuArray);

            //将json数据返回给客户端
            response.setContentType("text/html; charset=utf-8");;
            response.getWriter().write(json);
        } catch (SQLException e) {
            e.printStackTrace();
        }

    }

    protected void doGet(javax.servlet.http.HttpServletRequest request, javax.servlet.http.HttpServletResponse response) throws javax.servlet.ServletException, IOException {
        this.doPost(request, response);
    }

}
这里把list中的对象转换为Json格式的数组
Gson gson = new Gson();
String json = gson.toJson(stuArray);
需要导入
import com.google.gson.*;
连接数据库
import java.sql.Connection;
import java.sql.DriverManager;
import java.sql.PreparedStatement;
import java.sql.ResultSet;
import java.sql.SQLException;
import java.sql.Statement;


/**
 * Created by Ruilin on 2017/12/27.
 */
public class DbManage {

    private static String driver = null;
    private static String url = null;
    private static String password = null;
    private static String user = null;
    private Connection con = null;
    private Statement state = null;
    private ResultSet rs = null;

    //加载驱动
    static {
        try {
            driver = "com.mysql.jdbc.Driver";
            url = "jdbc:mysql://localhost:3306/xxxxx?useUnicode=true&characterEncoding=UTF-8";
            password = "xxxxxx";
            user = "root";
            Class.forName(driver).newInstance();
        } catch (Exception e) {
            e.printStackTrace();
        }

    }

    //创建连接
    public static Connection getConnection() {
        try {
            return DriverManager.getConnection(url, user, password);
        } catch (SQLException e) {
            e.printStackTrace();
            return null;
        }
    }

    //返回查询结果
    public ResultSet ExecuteQuery(String sql) throws SQLException {
        con = this.getConnection();
        state = con.createStatement();
        rs = state.executeQuery(sql);
        return rs;
    }

    public void closeConnection() {
        try {
            if (!this.con.equals(null))
                this.con.close();
        } catch (SQLException e) {
            e.printStackTrace();
        }
        this.con = null;
    }

}
实体类封装类(Info)我再次懒得发了
然后是获取数据
import FitnessSystem.db.DbManage;
import FitnessSystem.entity.Info;

import java.sql.ResultSet;
import java.sql.SQLException;
import java.util.ArrayList;

/**
 * Created by Ruilin on 2017/12/27.
 */
public class Student {
    public ArrayList<Info> getStudentList() throws SQLException {
        ArrayList<Info> allStu=new ArrayList<Info>();
        String sqlText="select * from fitness2017";
        DbManage db=new DbManage();
        ResultSet rs=null;
        rs=db.ExecuteQuery(sqlText);
        while (rs.next()){
            Info stuInfo=new Info();

            stuInfo.setSex(rs.getString("性别"));
            stuInfo.setHeight(rs.getString("身高"));
            stuInfo.setWeight(rs.getString("体重"));

            allStu.add(stuInfo);
        }
        db.closeConnection();
        return allStu;
    }
}
简单的总结下过程,前端用ajax请求Servlet,Servlet使用Student类获数据库取信息(装入List),再用Gson工具将该List转换成Json对象返回给客户端,客户端接收到返回的Json对象后对其进行解析并将相应数据填入Echarts中,最后显示图表